


SWELTERING
CITIES
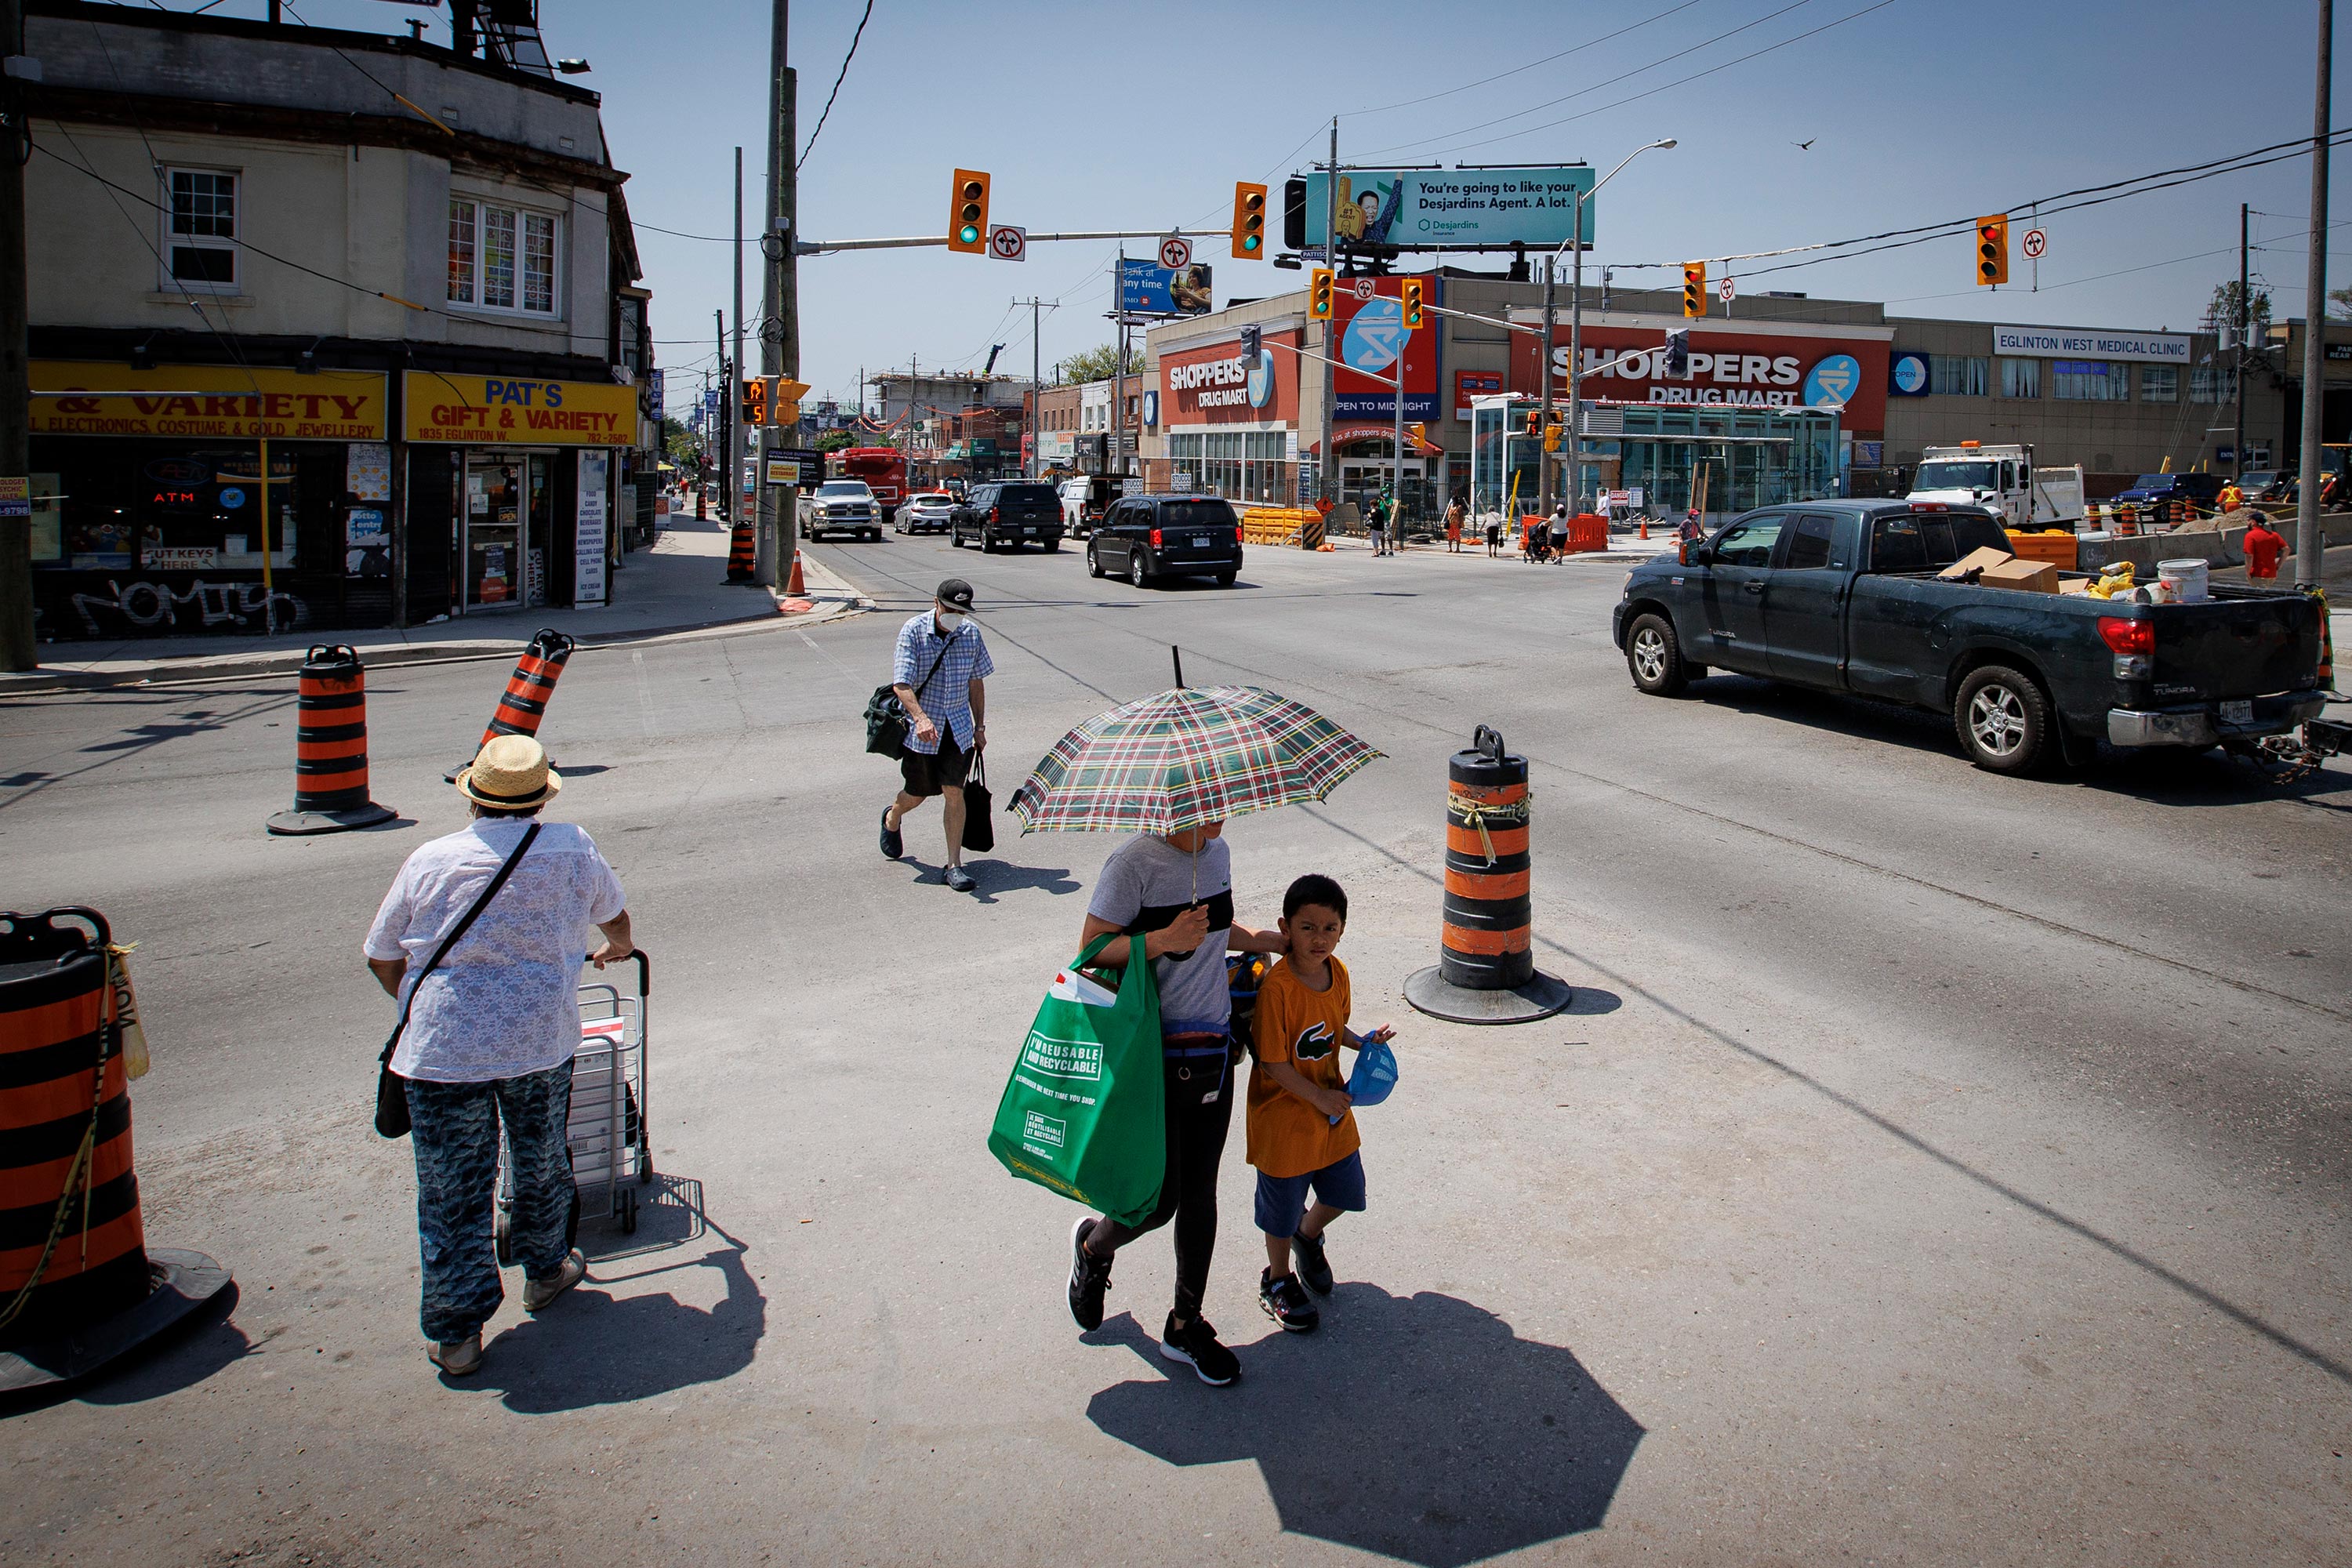
Picture yourself walking through the downtown core of a city on a hot day in July. Heat radiates up from the asphalt. Rows of tall buildings stop the breeze from reaching you. There are no trees in sight — only blocks of concrete, steel and sweltering heat.
Extreme heat caused by climate change is already killing Canadians, and it’s going to get worse. The warming planet means heat waves will be more intense and more frequent than before.
That heat will be magnified in cities. The fact is, Canadians on the front lines of climate change don’t just live in the North, on the coasts and on the Prairies; they also live in downtown apartments or highrises in the suburbs.

In fact, the majority of Canadians live in literal hotspots. The country is becoming increasingly urban, and 73.7 per cent of Canadians already live in cities, which are susceptible to what is called the urban heat island effect. It’s a well-known phenomenon that has been studied in Canada and around the world.
Essentially, the way that cities are built means they trap and radiate heat, making them several degrees warmer than the surrounding countryside, sometimes by as much as 12 C.
“Because we’re a northern country, we’re actually warming up faster and more intensely than other places in the world,” said Ian Mauro, the executive director of the Prairie Climate Centre at the University of Winnipeg.
“When you add the urban heat island on top of that, it’s a heat amplification.”
Take this example of a typical North American city on a calm, clear night. A light wind blows across the city, which is surrounded by a rural area.
On the outskirts of town, the air temperature is 2 C warmer than the surrounding countryside.
In the city, the area around a park is 4 C warmer than the countryside, but still cooler than more densely built parts of town.
It’s typically hottest in the most dense, constructed parts of the city. In this case, the downtown is 8 C warmer than the surrounding rural area.
Some city-dwellers might be able to escape the stifling heat by cranking up their air conditioning or visiting a cottage in the countryside. Others might be fortunate enough to live in neighbourhoods where tree-lined boulevards shield their homes from the sun.


But what about everyone else? What happens to those who can’t stand the heat, and who don’t have the money or resources to get out of the proverbial kitchen?
People might feel they can ignore the effects of climate change, given that they’re surrounded by all the technology and resources of a metropolis.
That’s simply not the case, says Iain D. Stewart, a research fellow at the University of Toronto’s Global Cities Institute and an international expert on the heat island effect.

“There’s that idea or feeling that cities are constructed environments and we’re not susceptible to sea level change or severe drought, because we have all the resources at our fingertips and we live in a condominium building in downtown Toronto or Montreal,” he said.
In fact, Stewart says the way most cities are designed actually makes heat worse.
The layout of a city plays a major role in how heat is trapped and amplified.
Temperatures are typically lower in parks and green spaces.
Built-up neighbourhoods with highrise buildings will typically be warmer.
Let’s zoom in to street level.
Tall buildings packed closely together block the wind and trap radiation.
Dark surfaces like asphalt roads and tar roofs absorb the sun’s radiation.
Human activities like running an air conditioning unit or a car engine release extra heat into the environment.
Stewart says many urban environments have natural features, like a breeze from a nearby body of water, that could help beat the heat. But cities are often laid out without giving any thought to integrating those assets.
“The problem arises when we design our cities and build our communities in ways that counteract those benefits. If we build a cluster of highrise buildings right up against the waterfront, it can block those natural resources coming off the water to help ventilate the city,” Stewart said.

DEADLY CONSEQUENCES
The pressure is on policy-makers to find ways to adapt to increasingly severe and frequent heat waves.
Global temperature averages have already reached about 1.2 C above pre-industrial levels, and the impacts of the changing planet are already taking a toll on people’s health.
In 2010, extreme heat killed 291 people in Quebec. In 2018, a heat wave contributed to 86 deaths in the province, 66 of them in Montreal.

In Ontario, the deadly cost of extreme heat is difficult to track, because the province has a narrow definition of what counts; it only reports accidental deaths directly due to the heat, as opposed to deaths from an underlying condition exacerbated by the heat.
In British Columbia, a coroner’s report found that the record-breaking heat dome that hit in the summer of 2021 resulted in 619 heat-related deaths. The vast majority of the victims — 98 per cent — died indoors. Most of the people were elderly and vulnerable, and lived in buildings without air conditioning or an adequate cooling system, according to the review by the B.C. Coroners Service.
The world is barrelling towards a future with more of those types of extreme heat events, as greenhouse gas emissions rise.
To help illustrate that future in a tangible way, researchers have created the Climate Atlas of Canada, which allows people to explore the impacts of climate change on Canadian cities through an interactive map.
Ian Mauro, who oversees the Climate Atlas, says his projections don’t factor in how the urban heat island effect will make the heat worse, because future warming scenarios are usually based on global data that is then adjusted to a regional scale.
“We’re underestimating risk right now,” Mauro said.
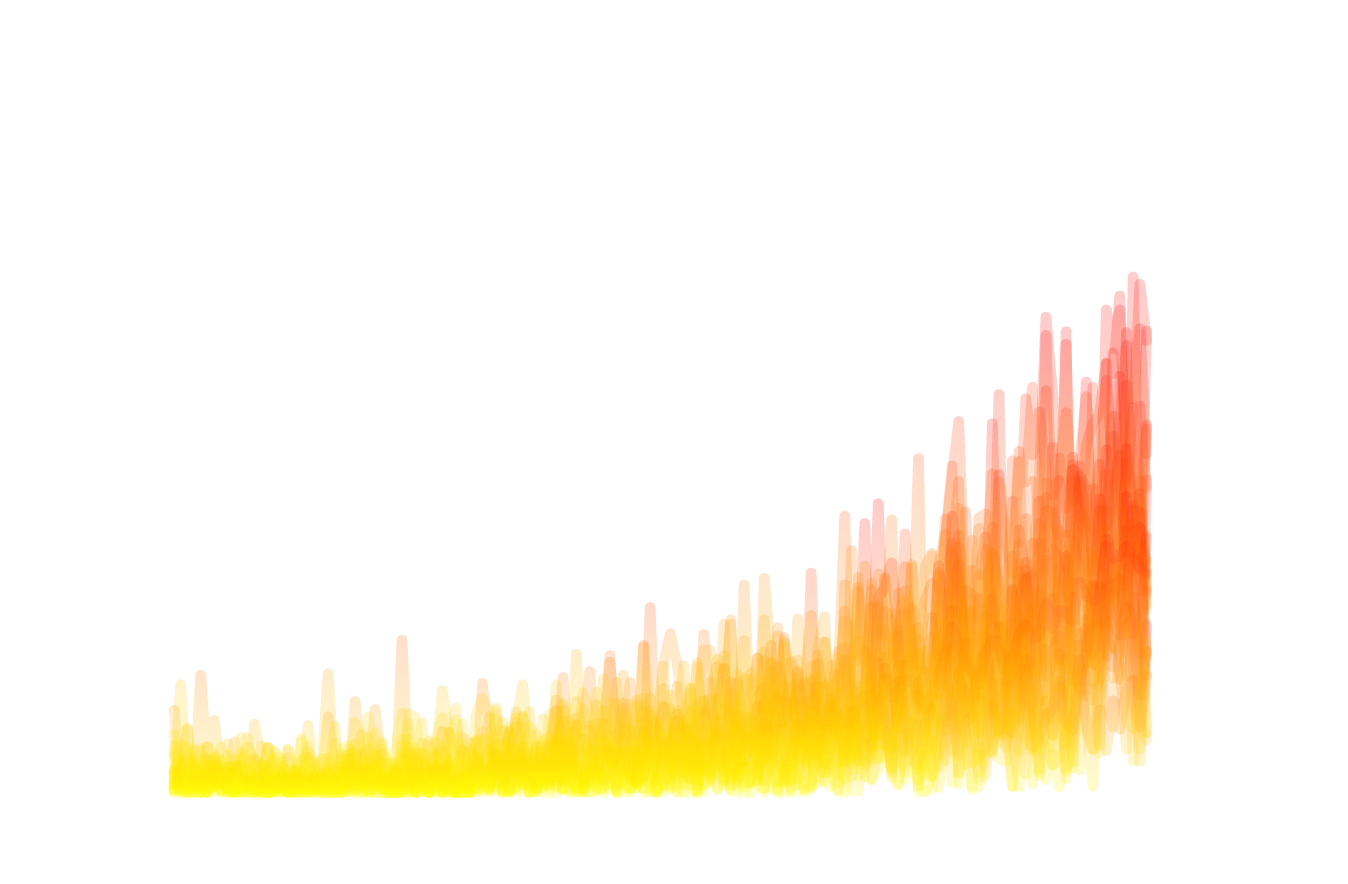
According to projections by the Climate Atlas, if emissions continue to increase at the current rate, the mean number of hot days above 30 C in Vancouver will nearly quintuple, jumping from a historical mean of one day a year to 4.9 days by the middle of the 21st century.
Though the Greater Vancouver Area will see fewer very hot days compared to other major Canadian cities, households in the region are also less prepared. As of 2019, most Vancouver homes did not have air conditioning.
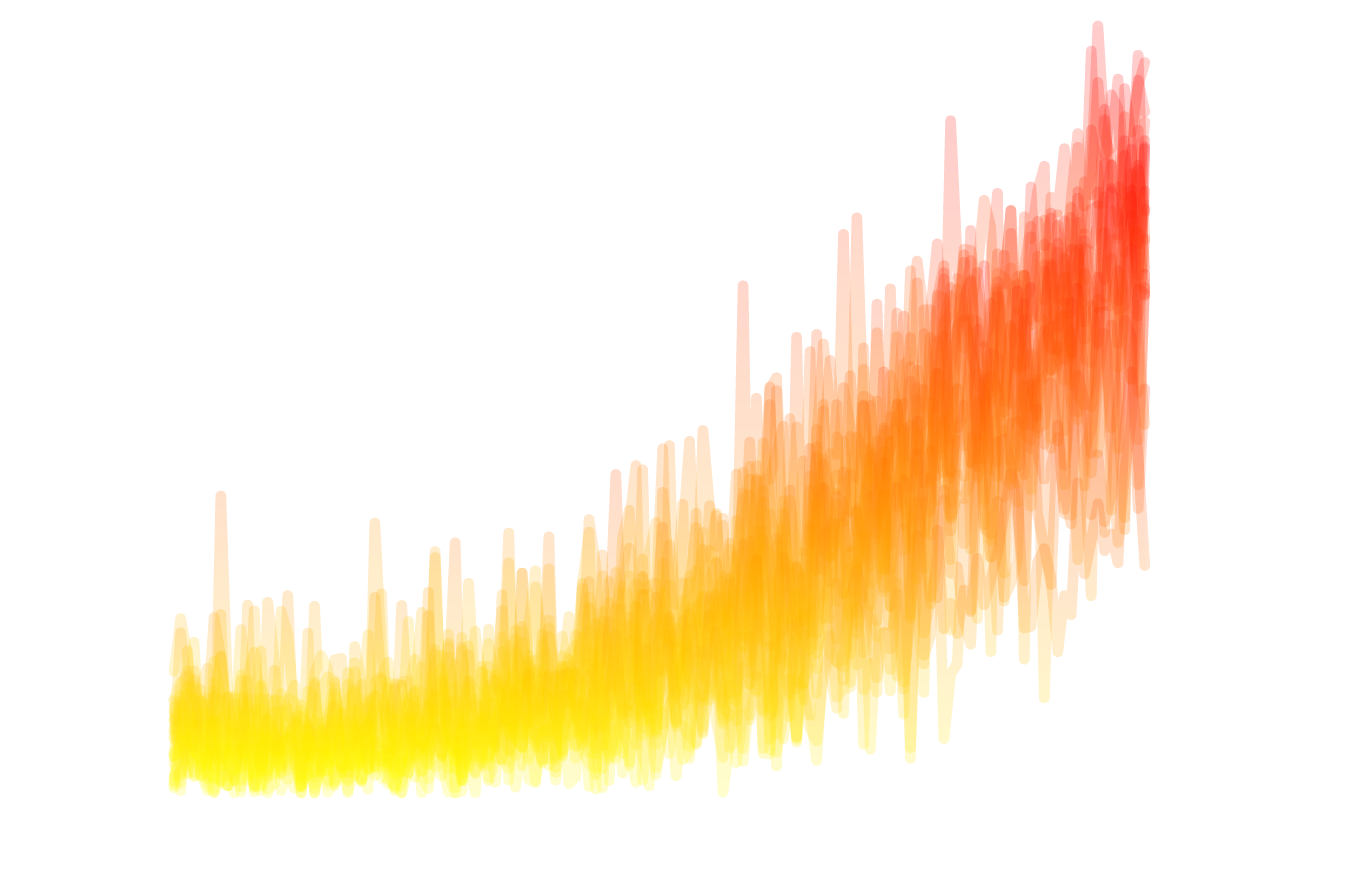
Toronto, historically, has seen a mean of 11.9 days a year where the temperature climbed above 30 C. That will increase by more than two and a half times if emissions increase at the current rate.
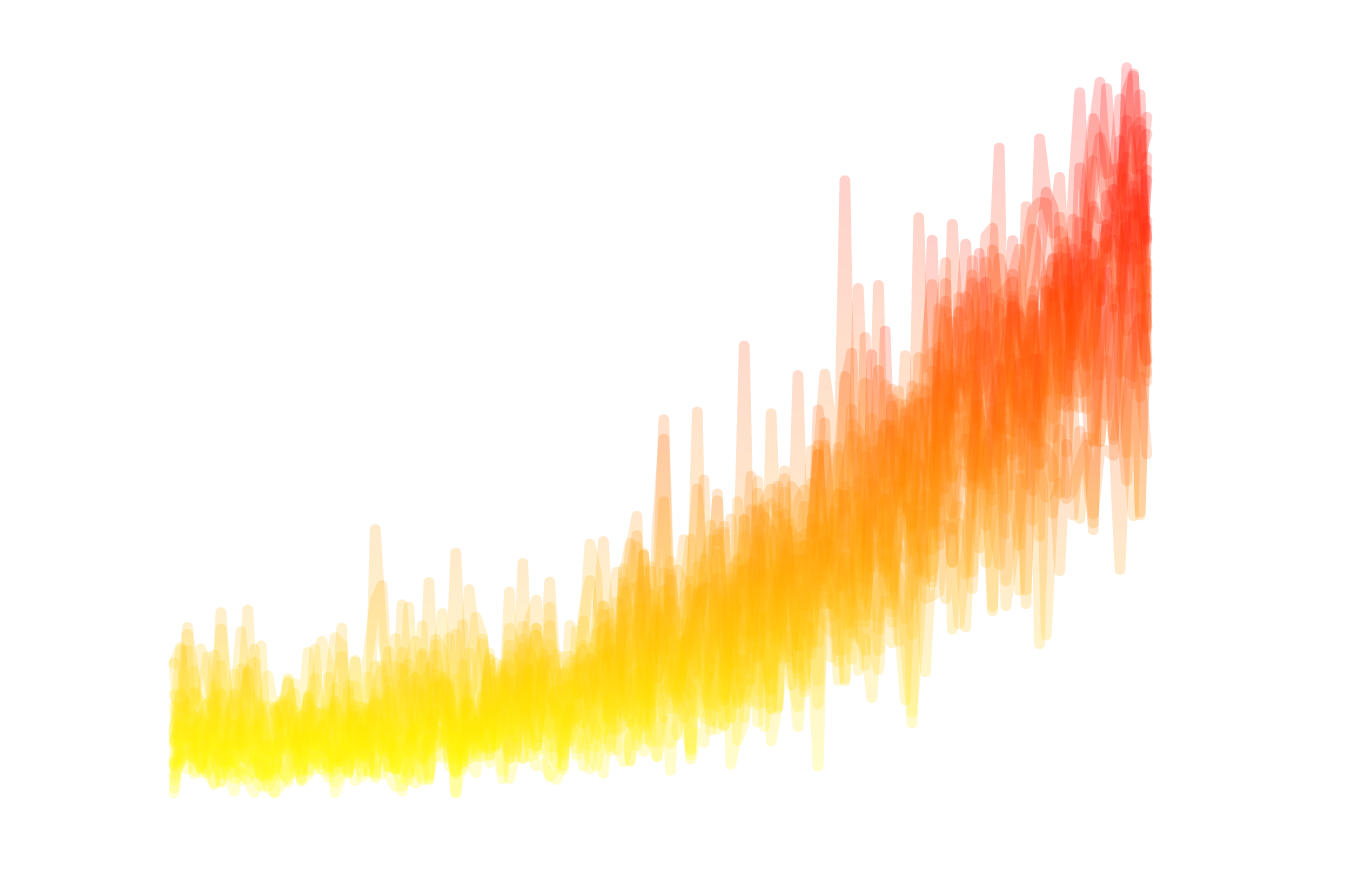
In Montreal, where the historical mean is 11.2 days a year above 30 C, it’s expected to rise by more than two and a half.
While the numbers offer a sense of how our cities are getting hotter, temperature doesn’t fully capture the scope of the problem.
Take, for instance, a large parking lot near a suburban mall. That might be the hottest place in a city, but Mauro explains the danger would be low, because most people would be sitting in air-conditioned vehicles.

But he says if you were to study a neighbourhood with few trees, with a lower socio-economic status and where most people live in highrise apartments with no air conditioning, those factors would all point to higher heat-related risk — even if the temperature there was cooler relative to the mall.

WHO’S AT RISK?
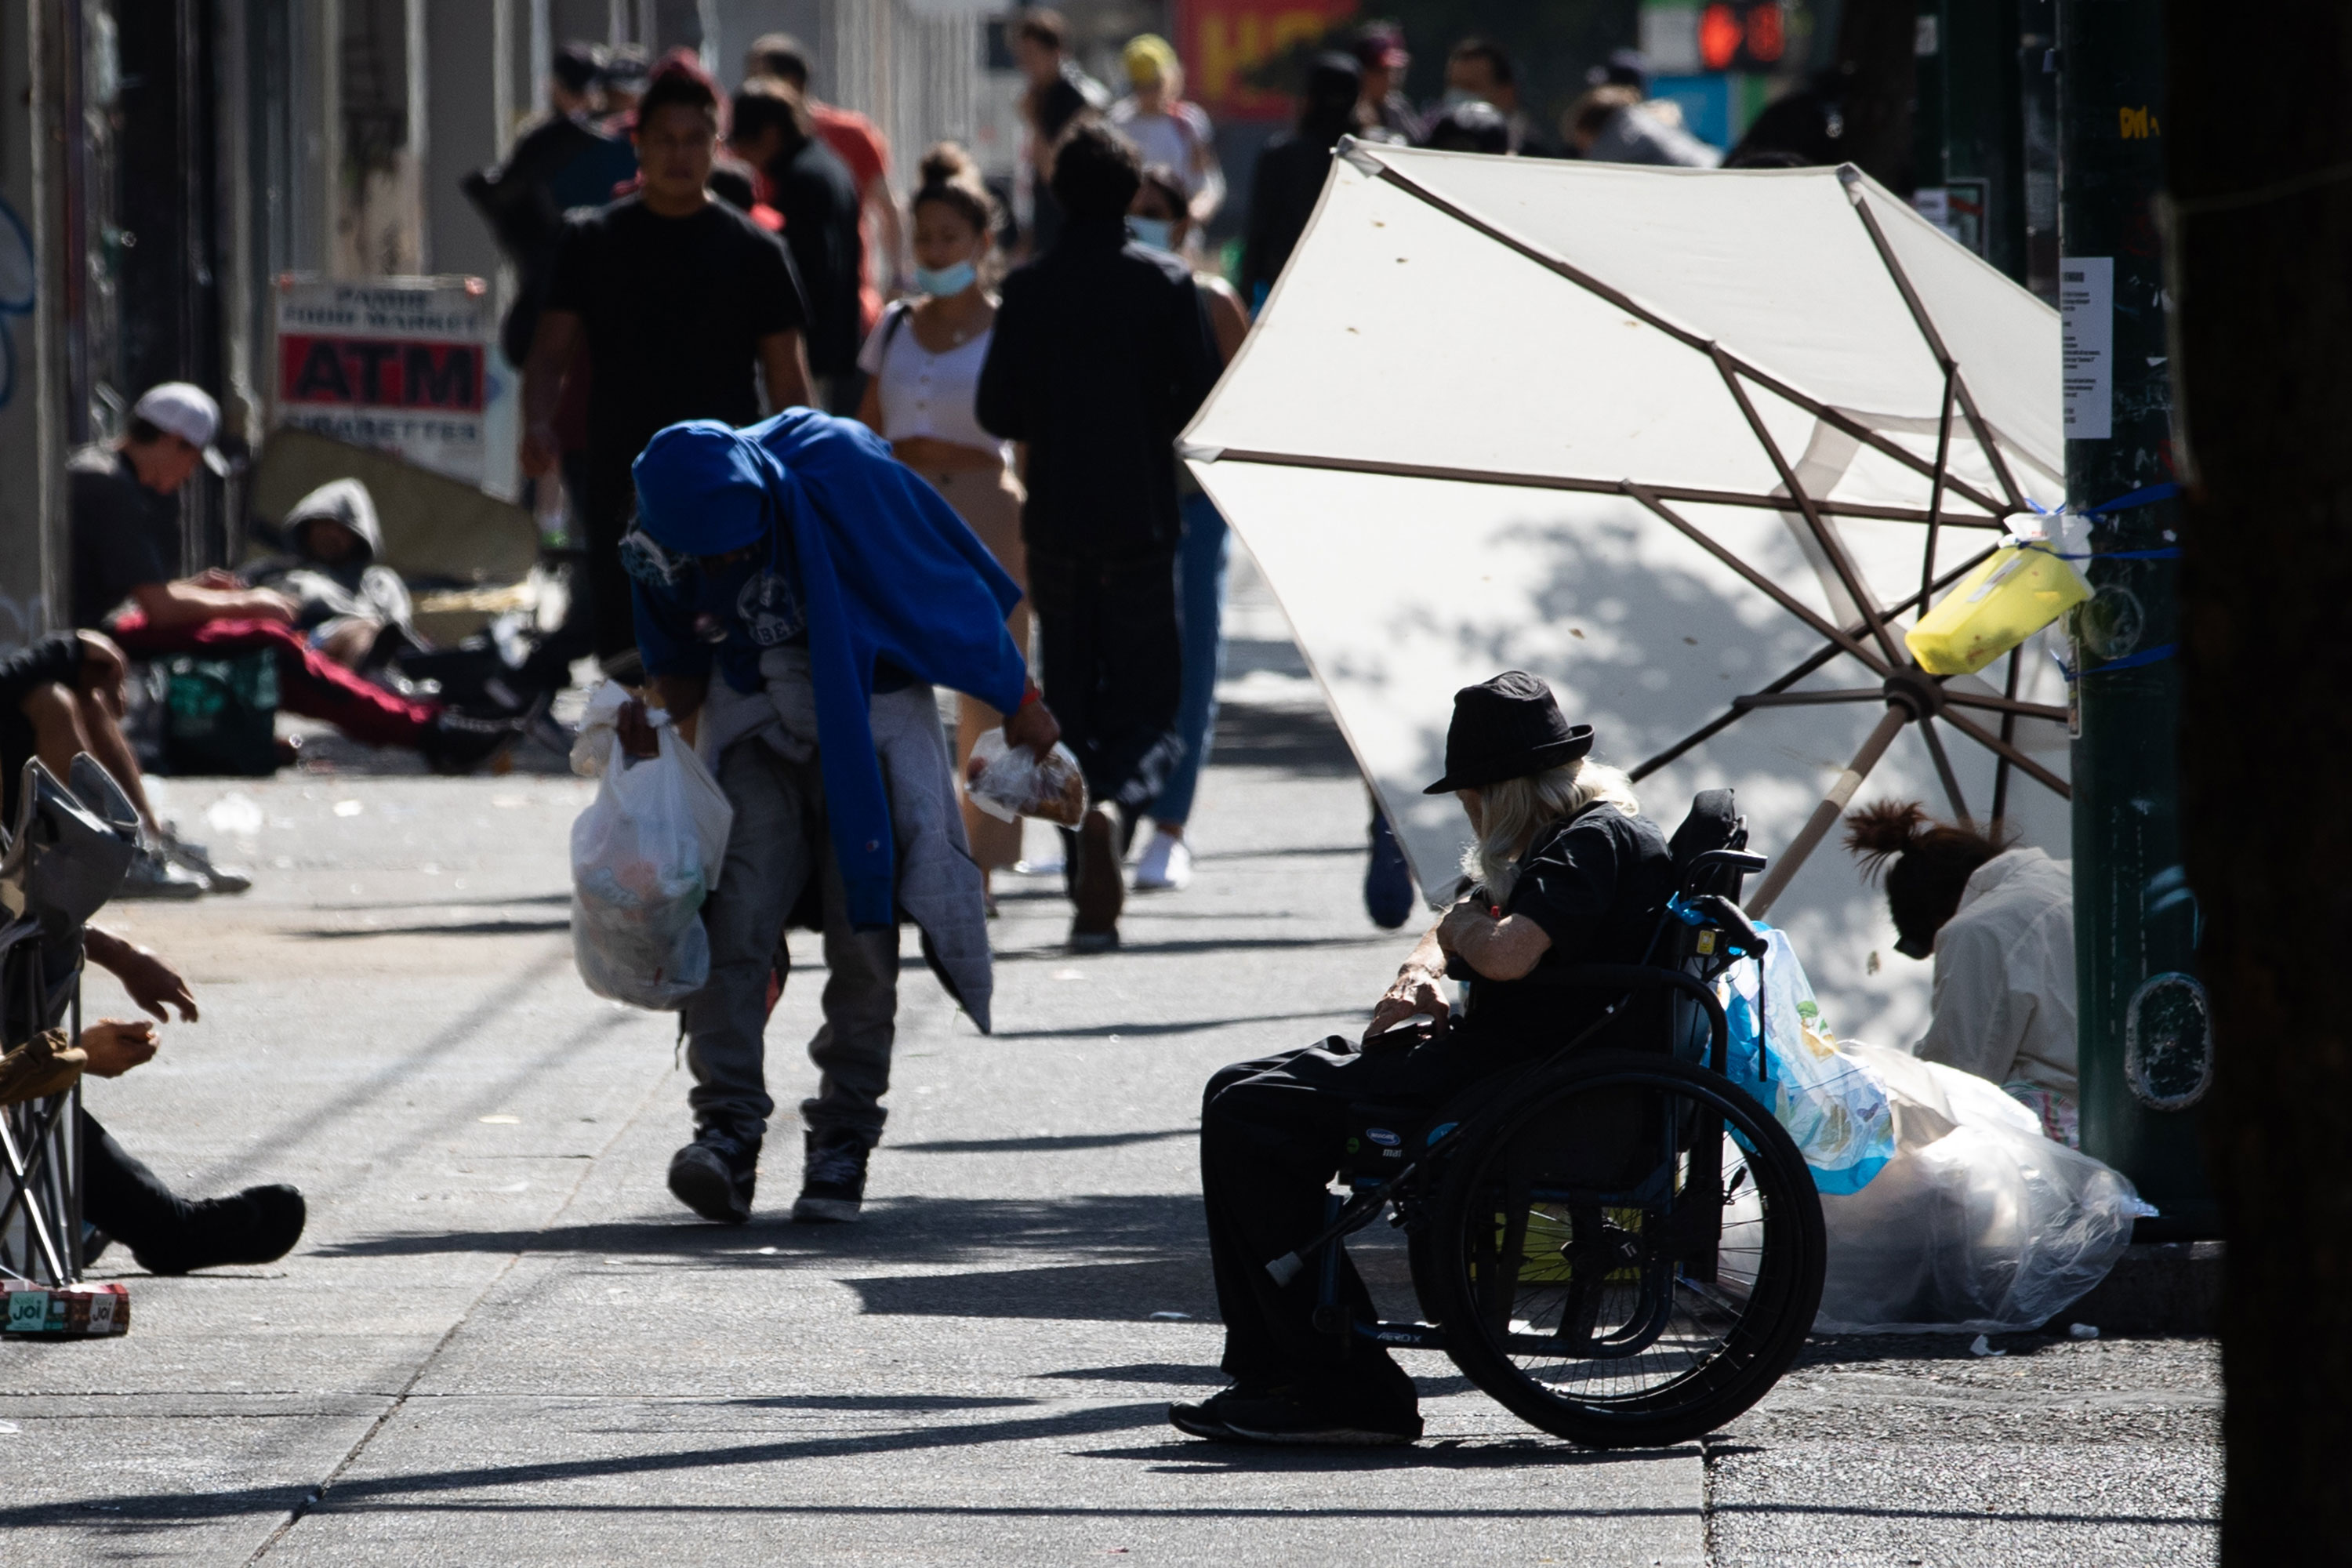
The United Nations’ Intergovernmental Panel on Climate Change is unequivocal: “Climate impacts are felt disproportionately in urban communities, with the most economically and socially marginalized most affected.”
The report flags heat stress in cities as a concern, and highlights drivers of inequality, including gender, class, race, age, ethnicity and sexuality.
A CBC News data analysis shows that immigrants and people with low income are most likely to live in Canada’s hottest urban areas.

Sarah Henderson, an environmental epidemiologist who is the scientific director of Environmental Health Services at the British Columbia Centre for Disease Control, has been looking into factors that might have contributed to deaths in the Vancouver area during the 2021 heat dome. She says figuring out who is most at risk during a heat wave isn’t just about temperature; it’s also about people’s ability to adapt.
“There were almost 100 people who had schizophrenia who died. I don’t want to downplay the importance of the urban heat island, but you can put two different populations in the urban heat island and it can have two very different impacts.”

In a report published in January 2022, she found that risk of heat-related death in the Vancouver area was associated with deprived neighbourhoods, where people generally have lower socio-economic status and are more likely to live alone. She also found that risk of death was associated with a lack of surrounding vegetation and green space.
An example where that played out was in New Westminster. The city, which sits on the banks of the Fraser River, had a high mortality rate during the heat dome. Many of those who died lived in the older downtown area of the city, on the south-facing slope of the river.
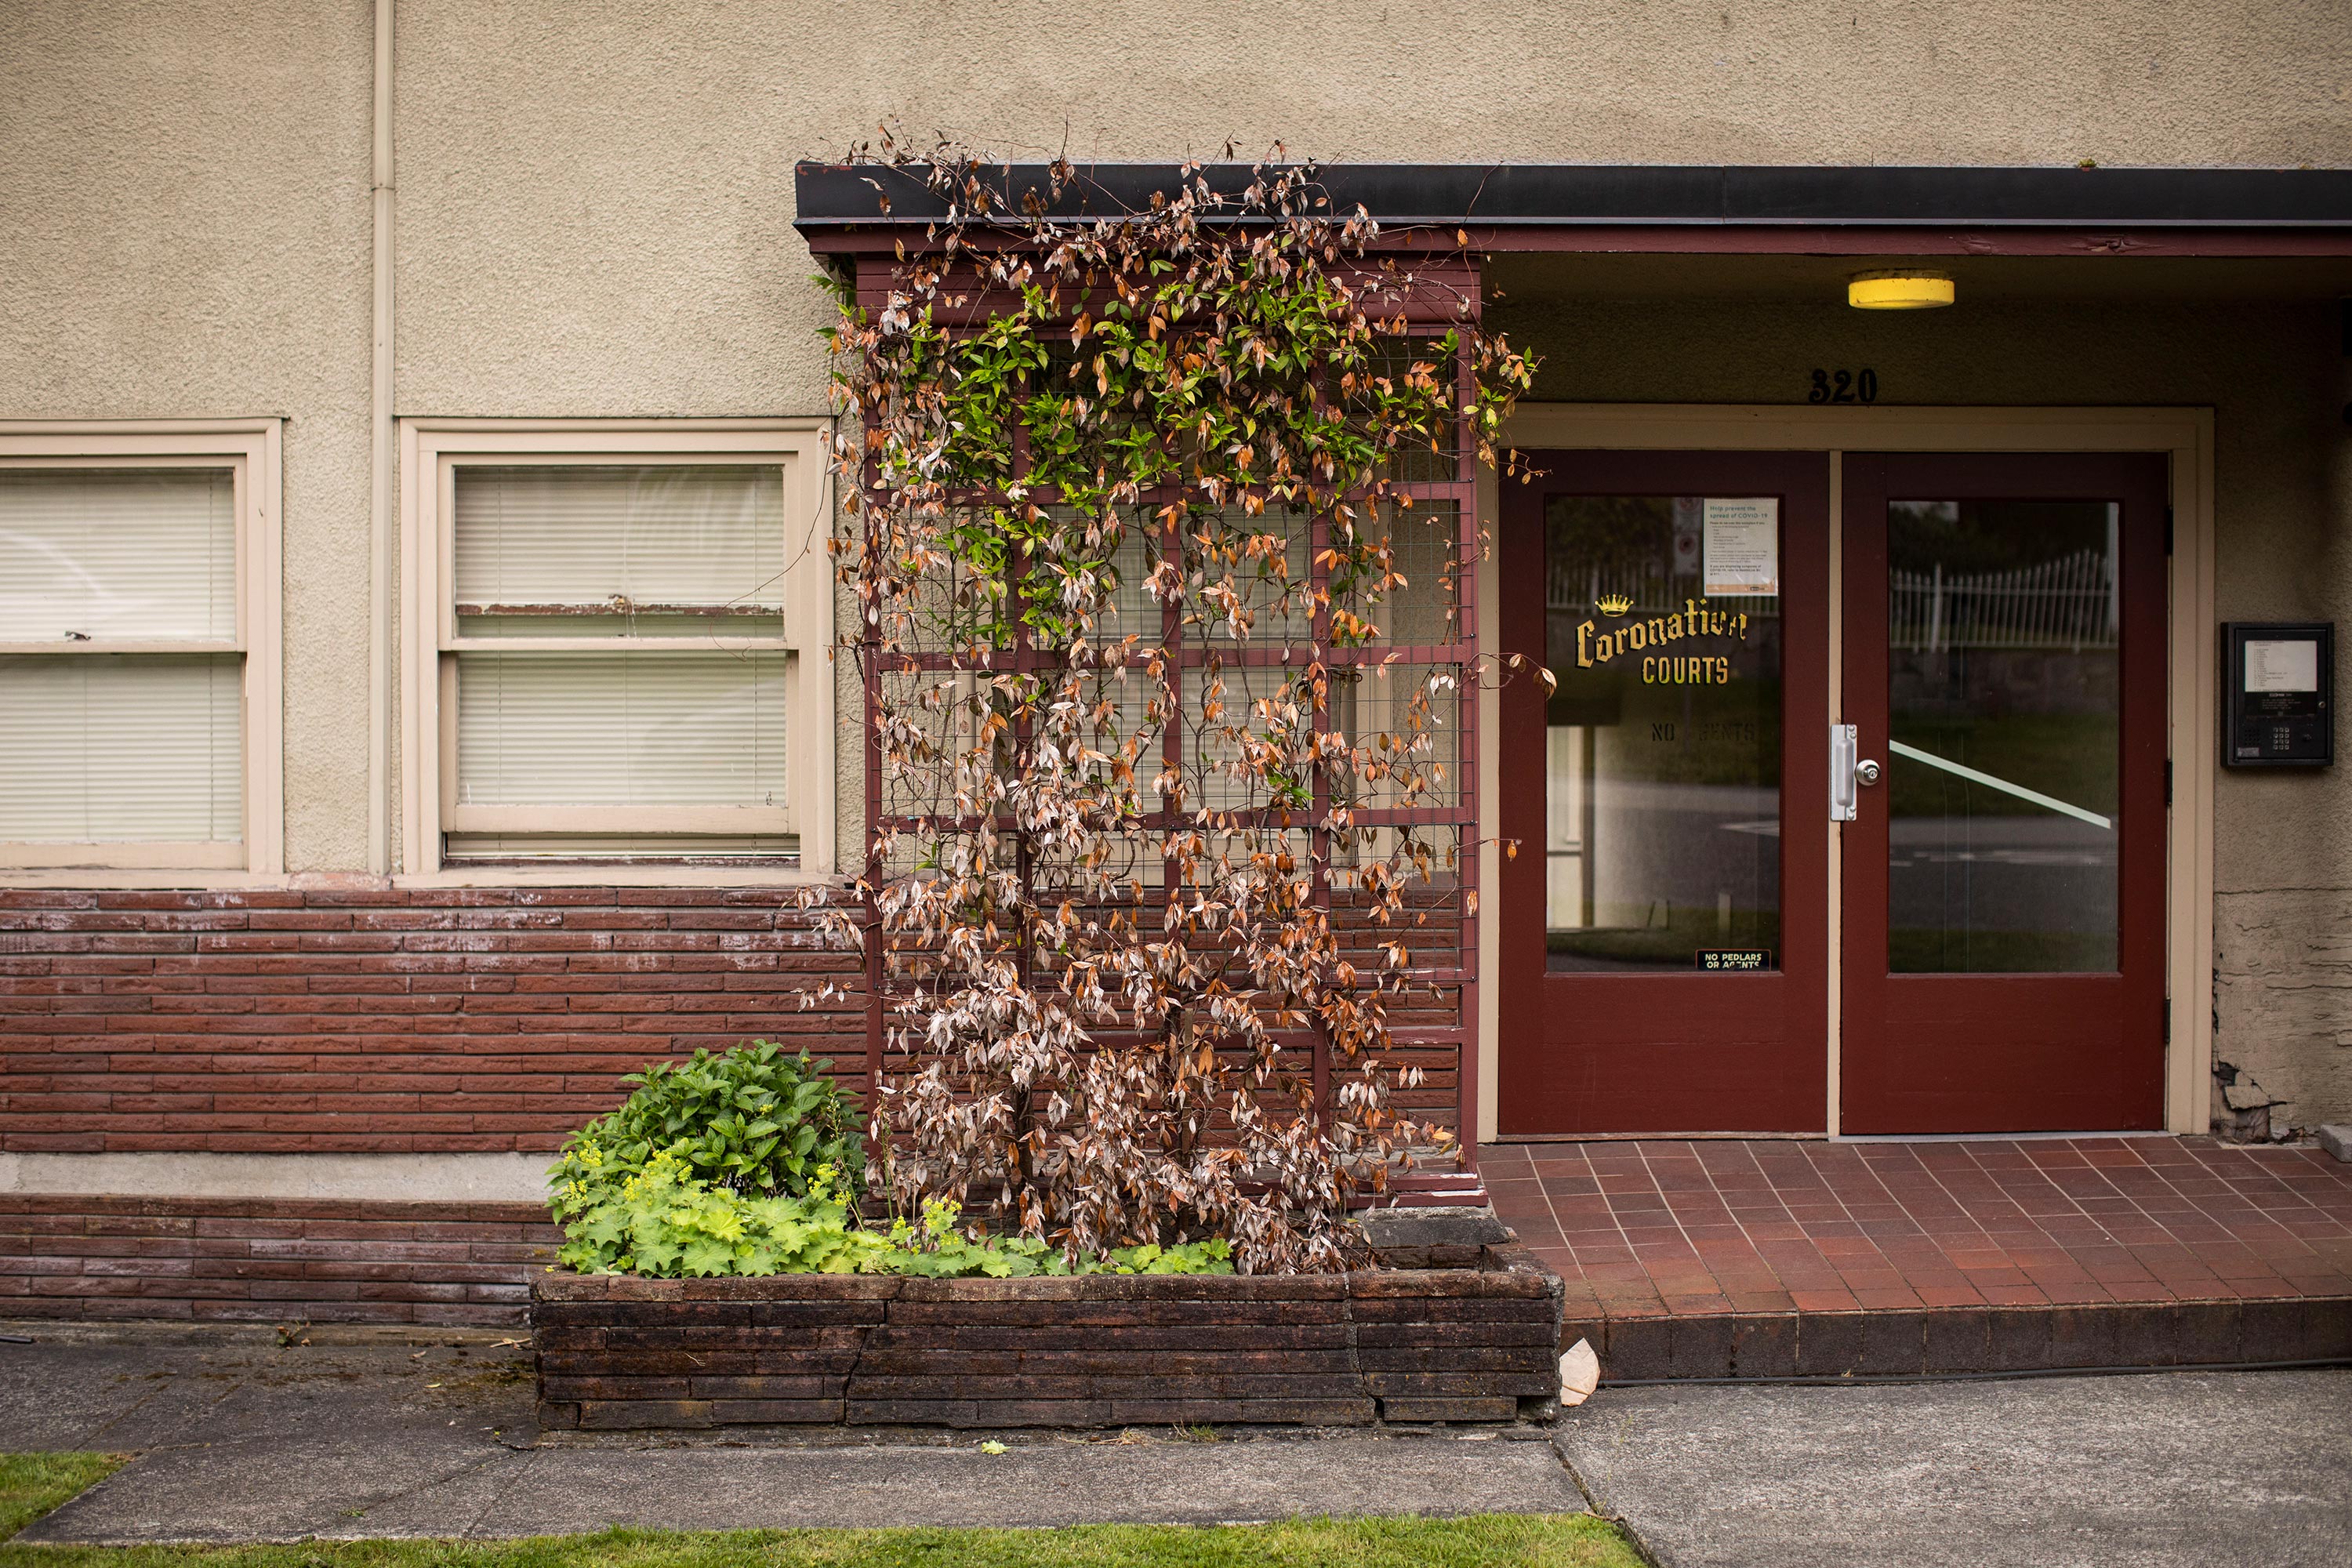
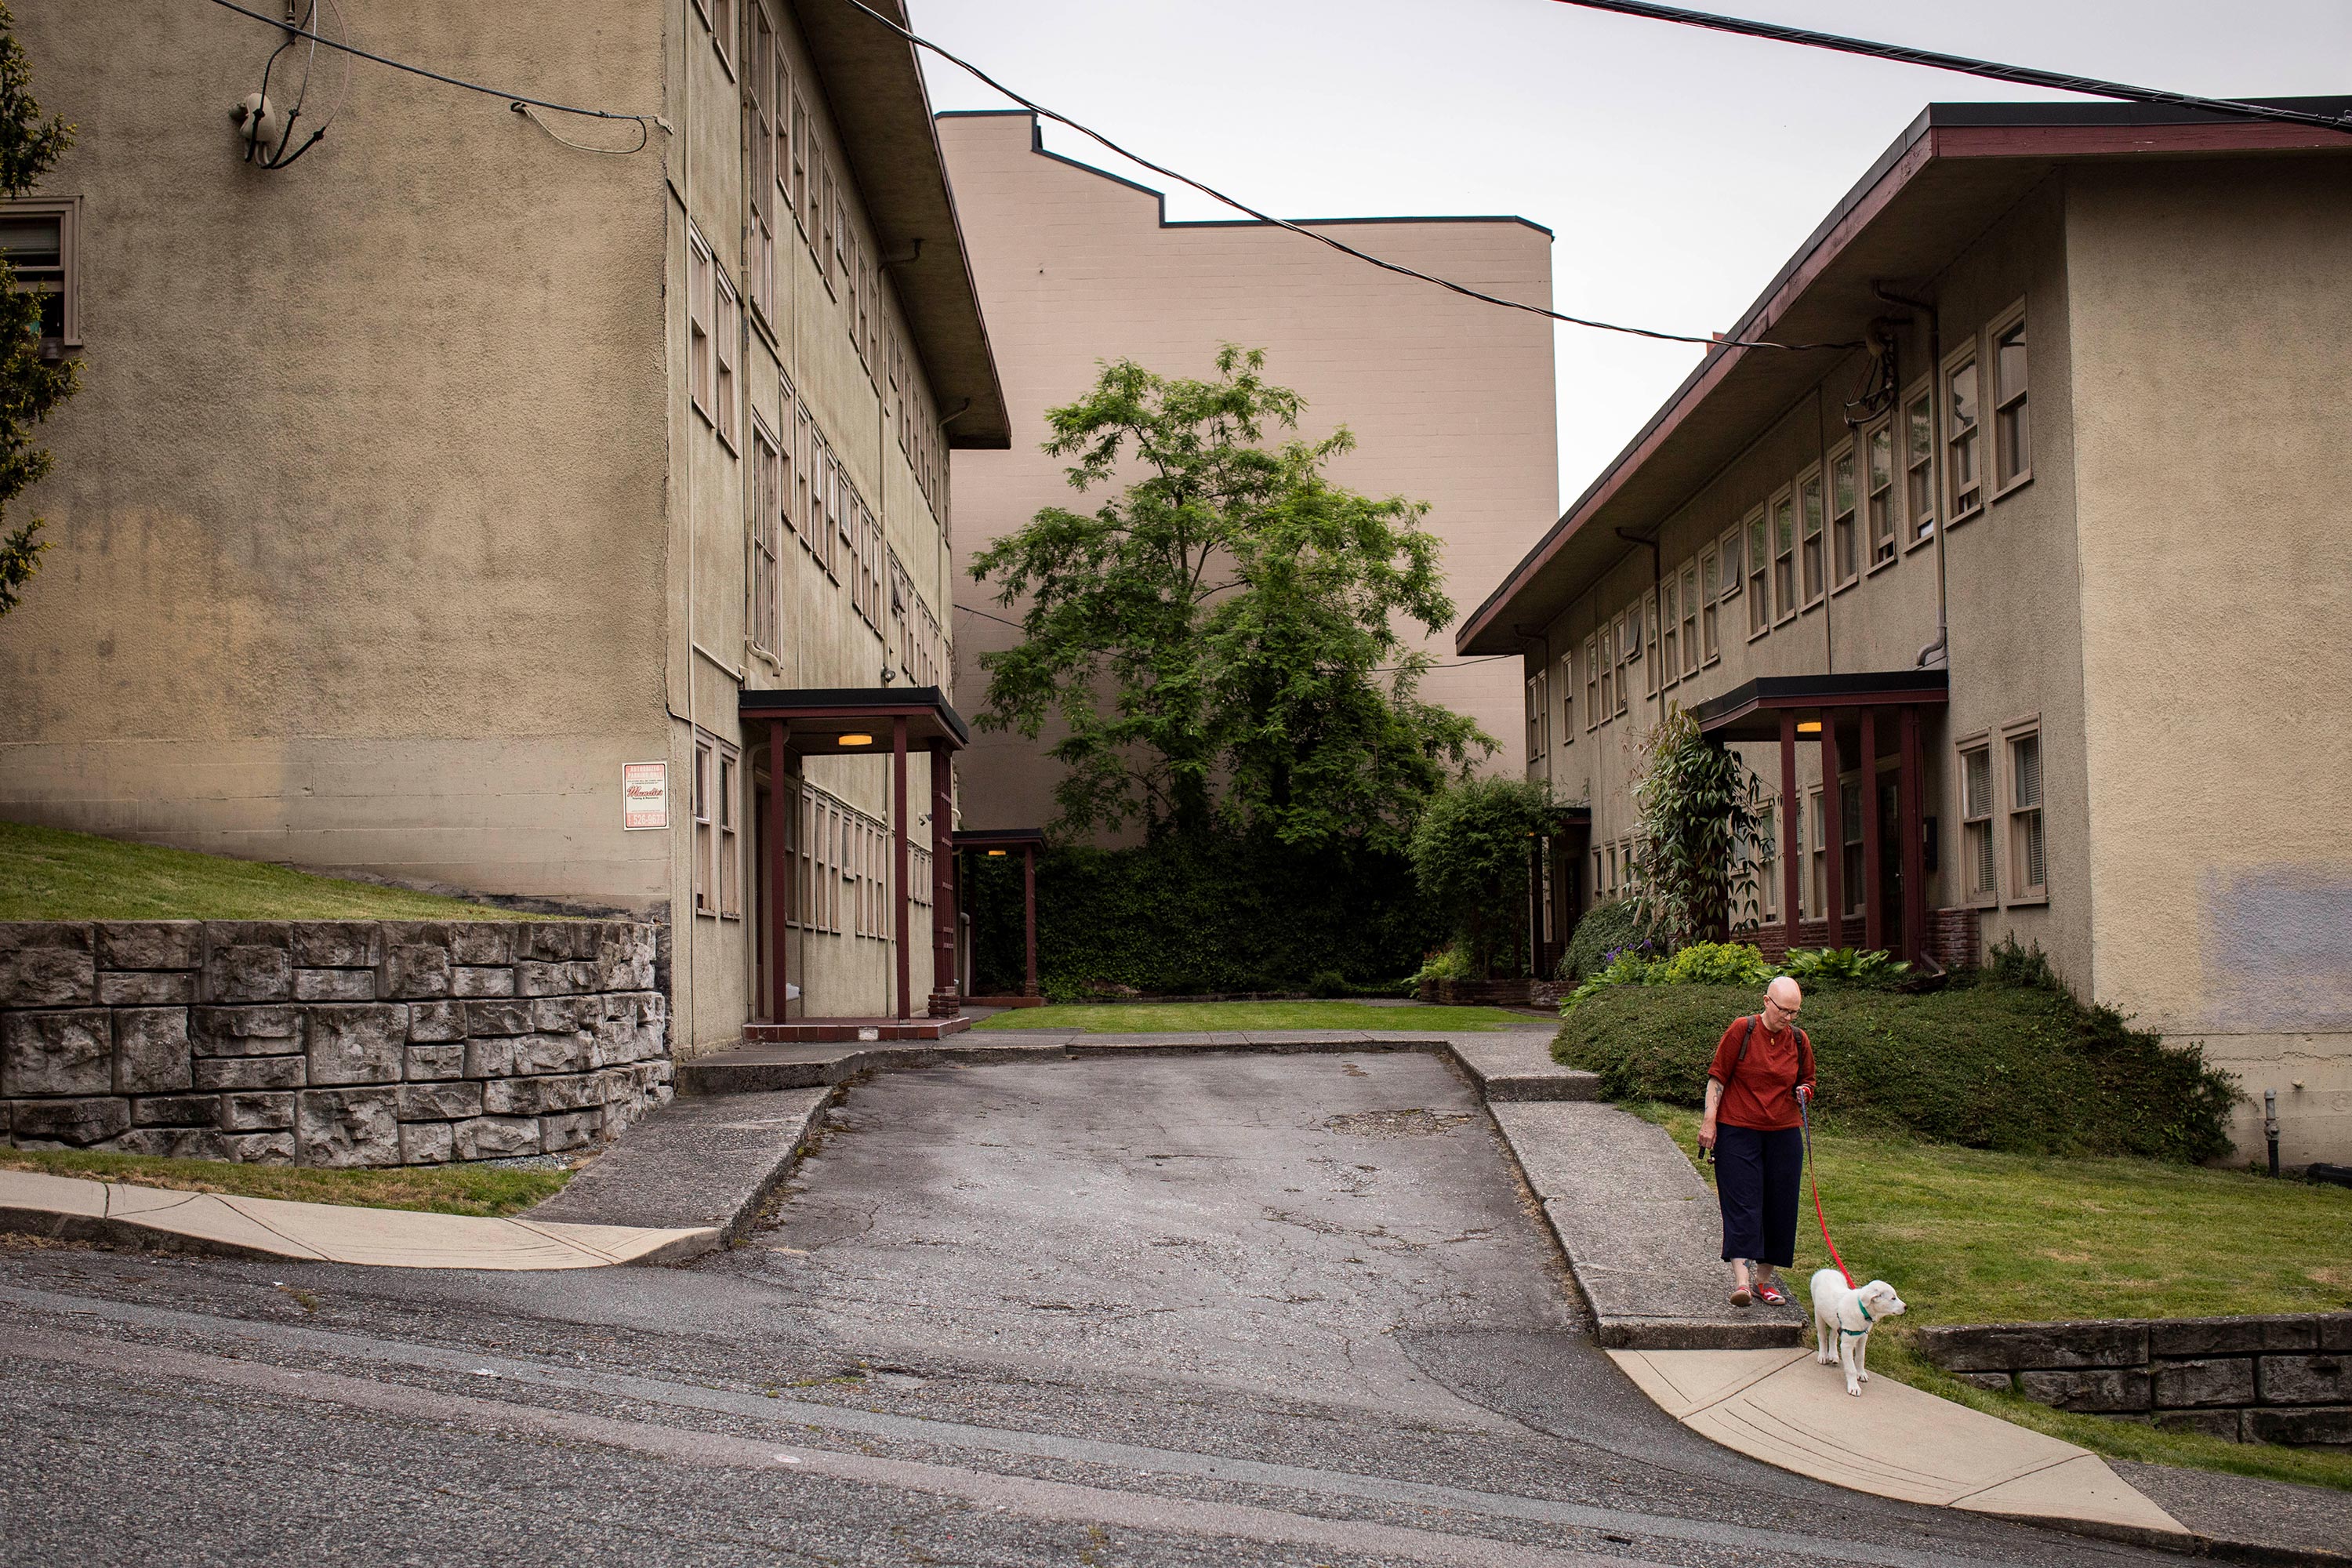
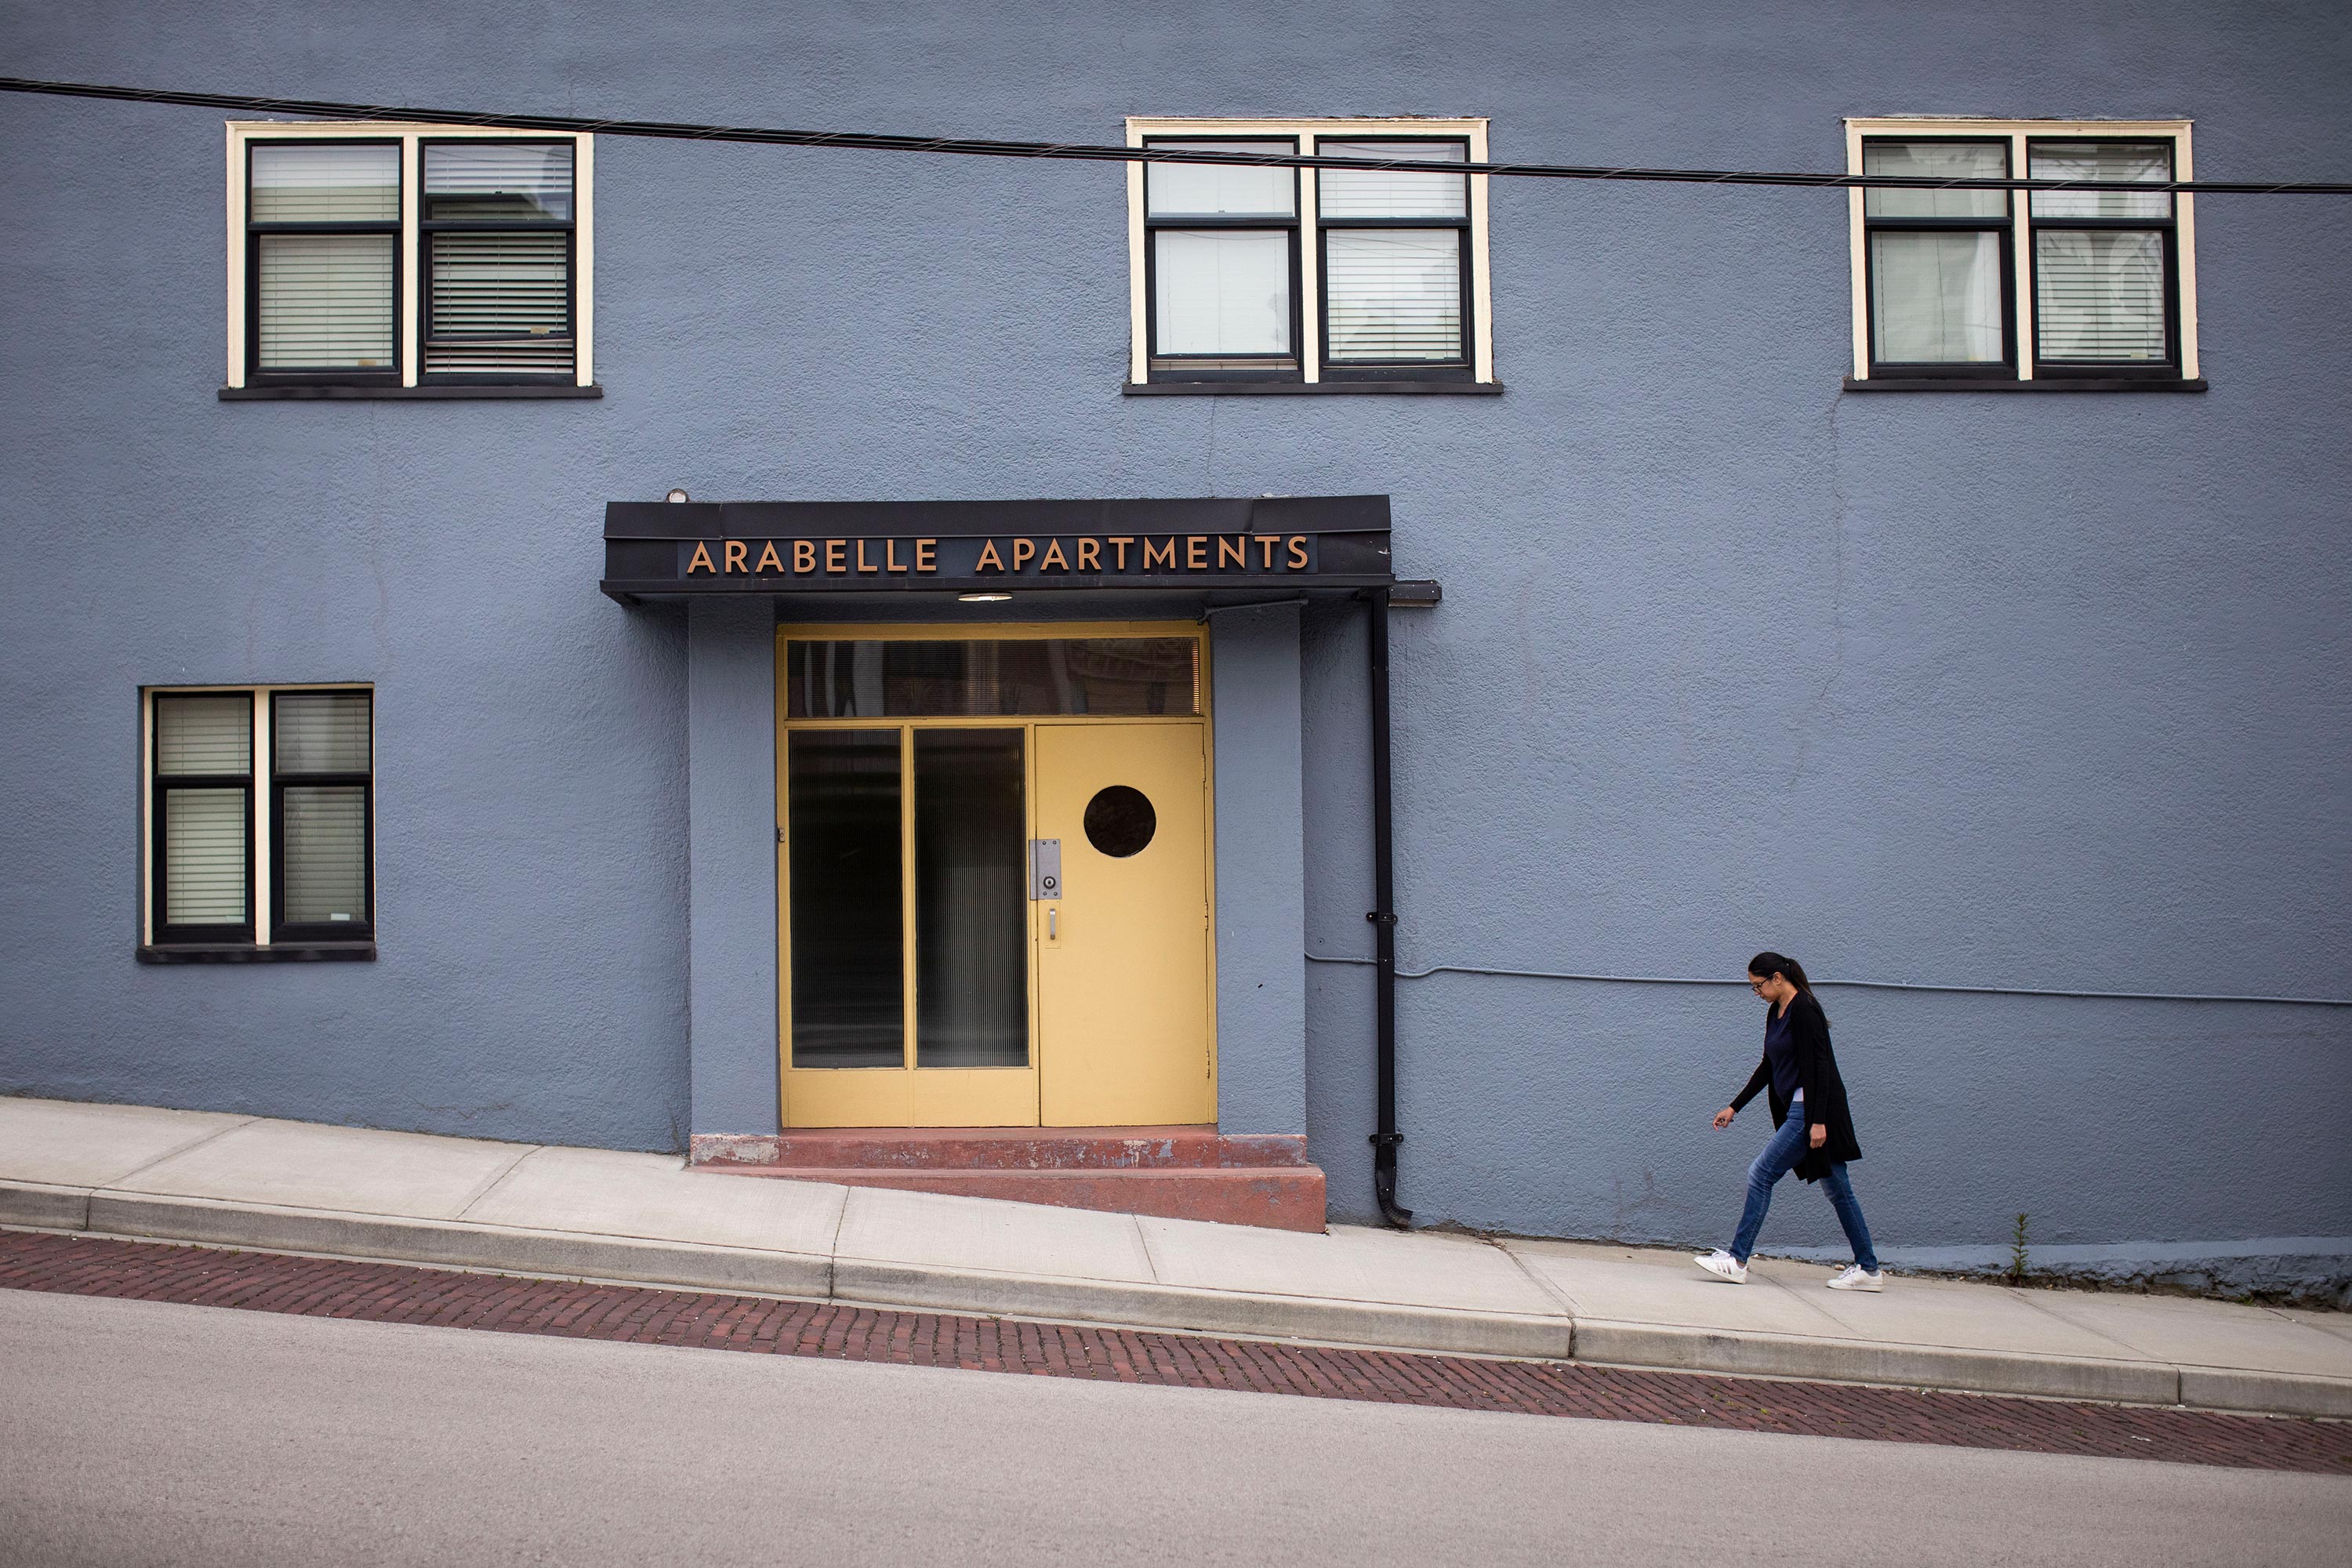
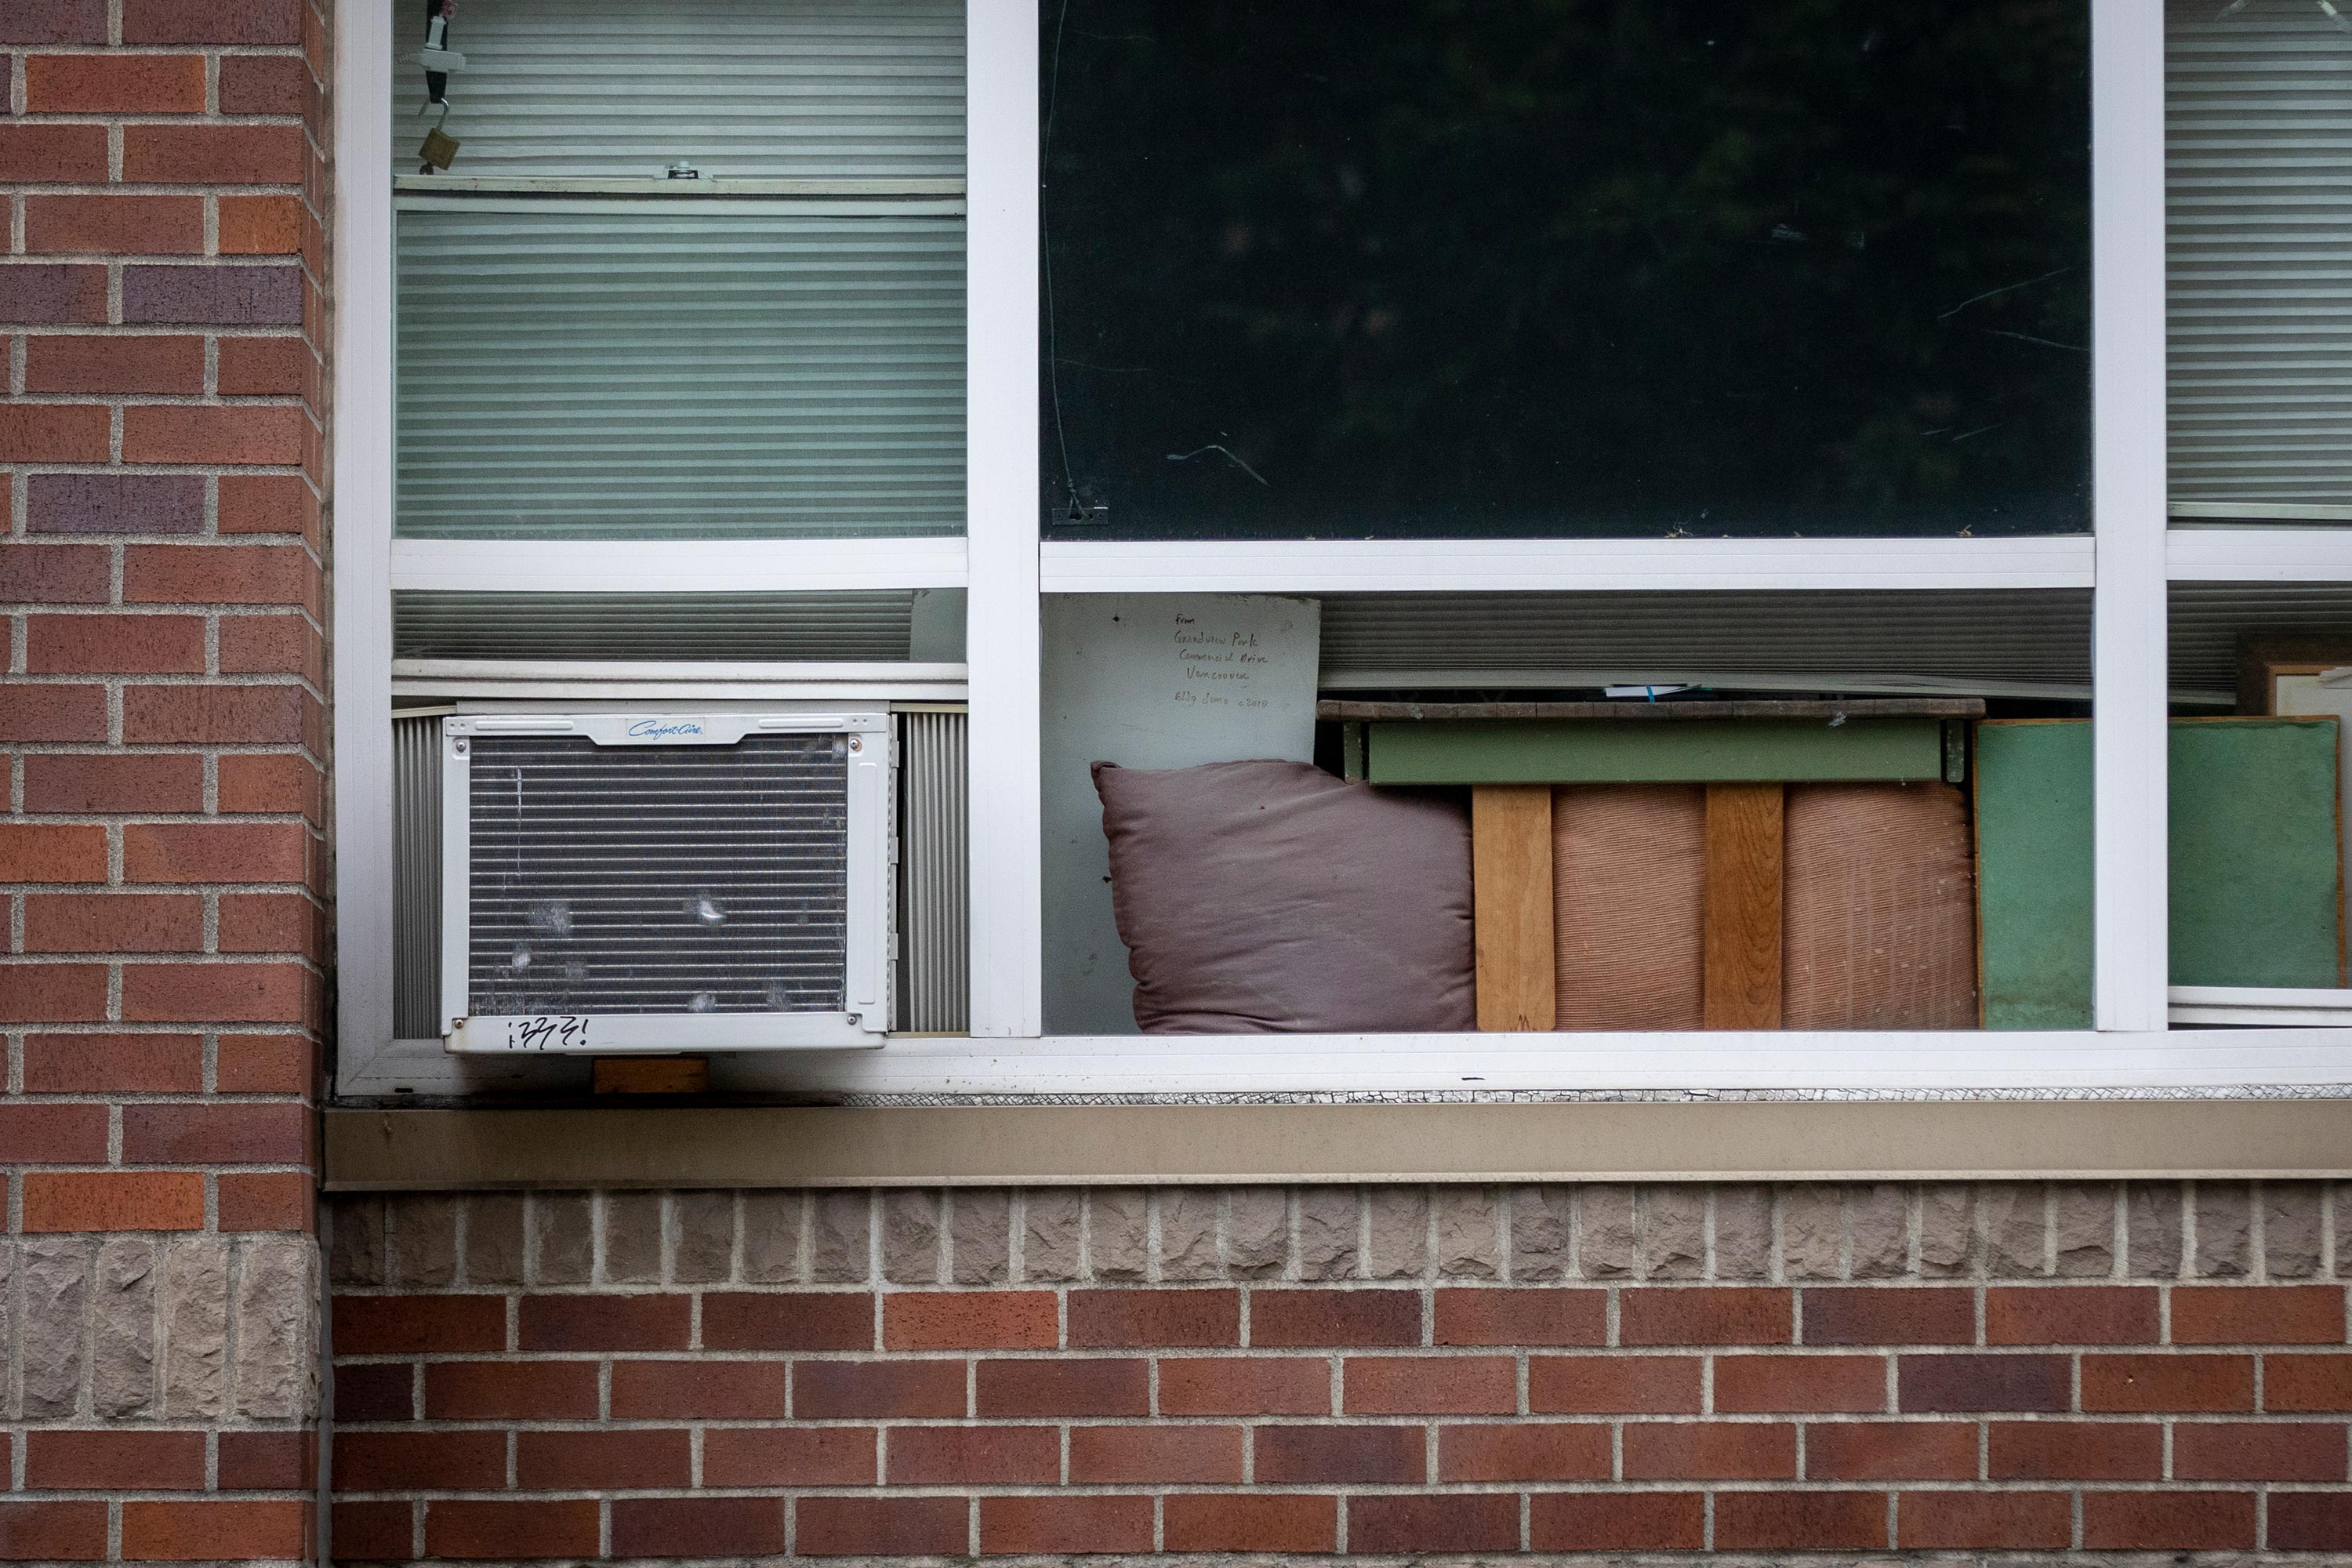
It’s an area with little vegetation that’s “just baking in the southern sun,” Henderson said. Plus she says there are a lot of older, low-level, multi-residential buildings with single-paned windows, which she compares to greenhouses because of how they accumulate heat.
“We should not be building buildings that can get so hot that people die inside of them, at this point in the climate crisis,” Henderson said.
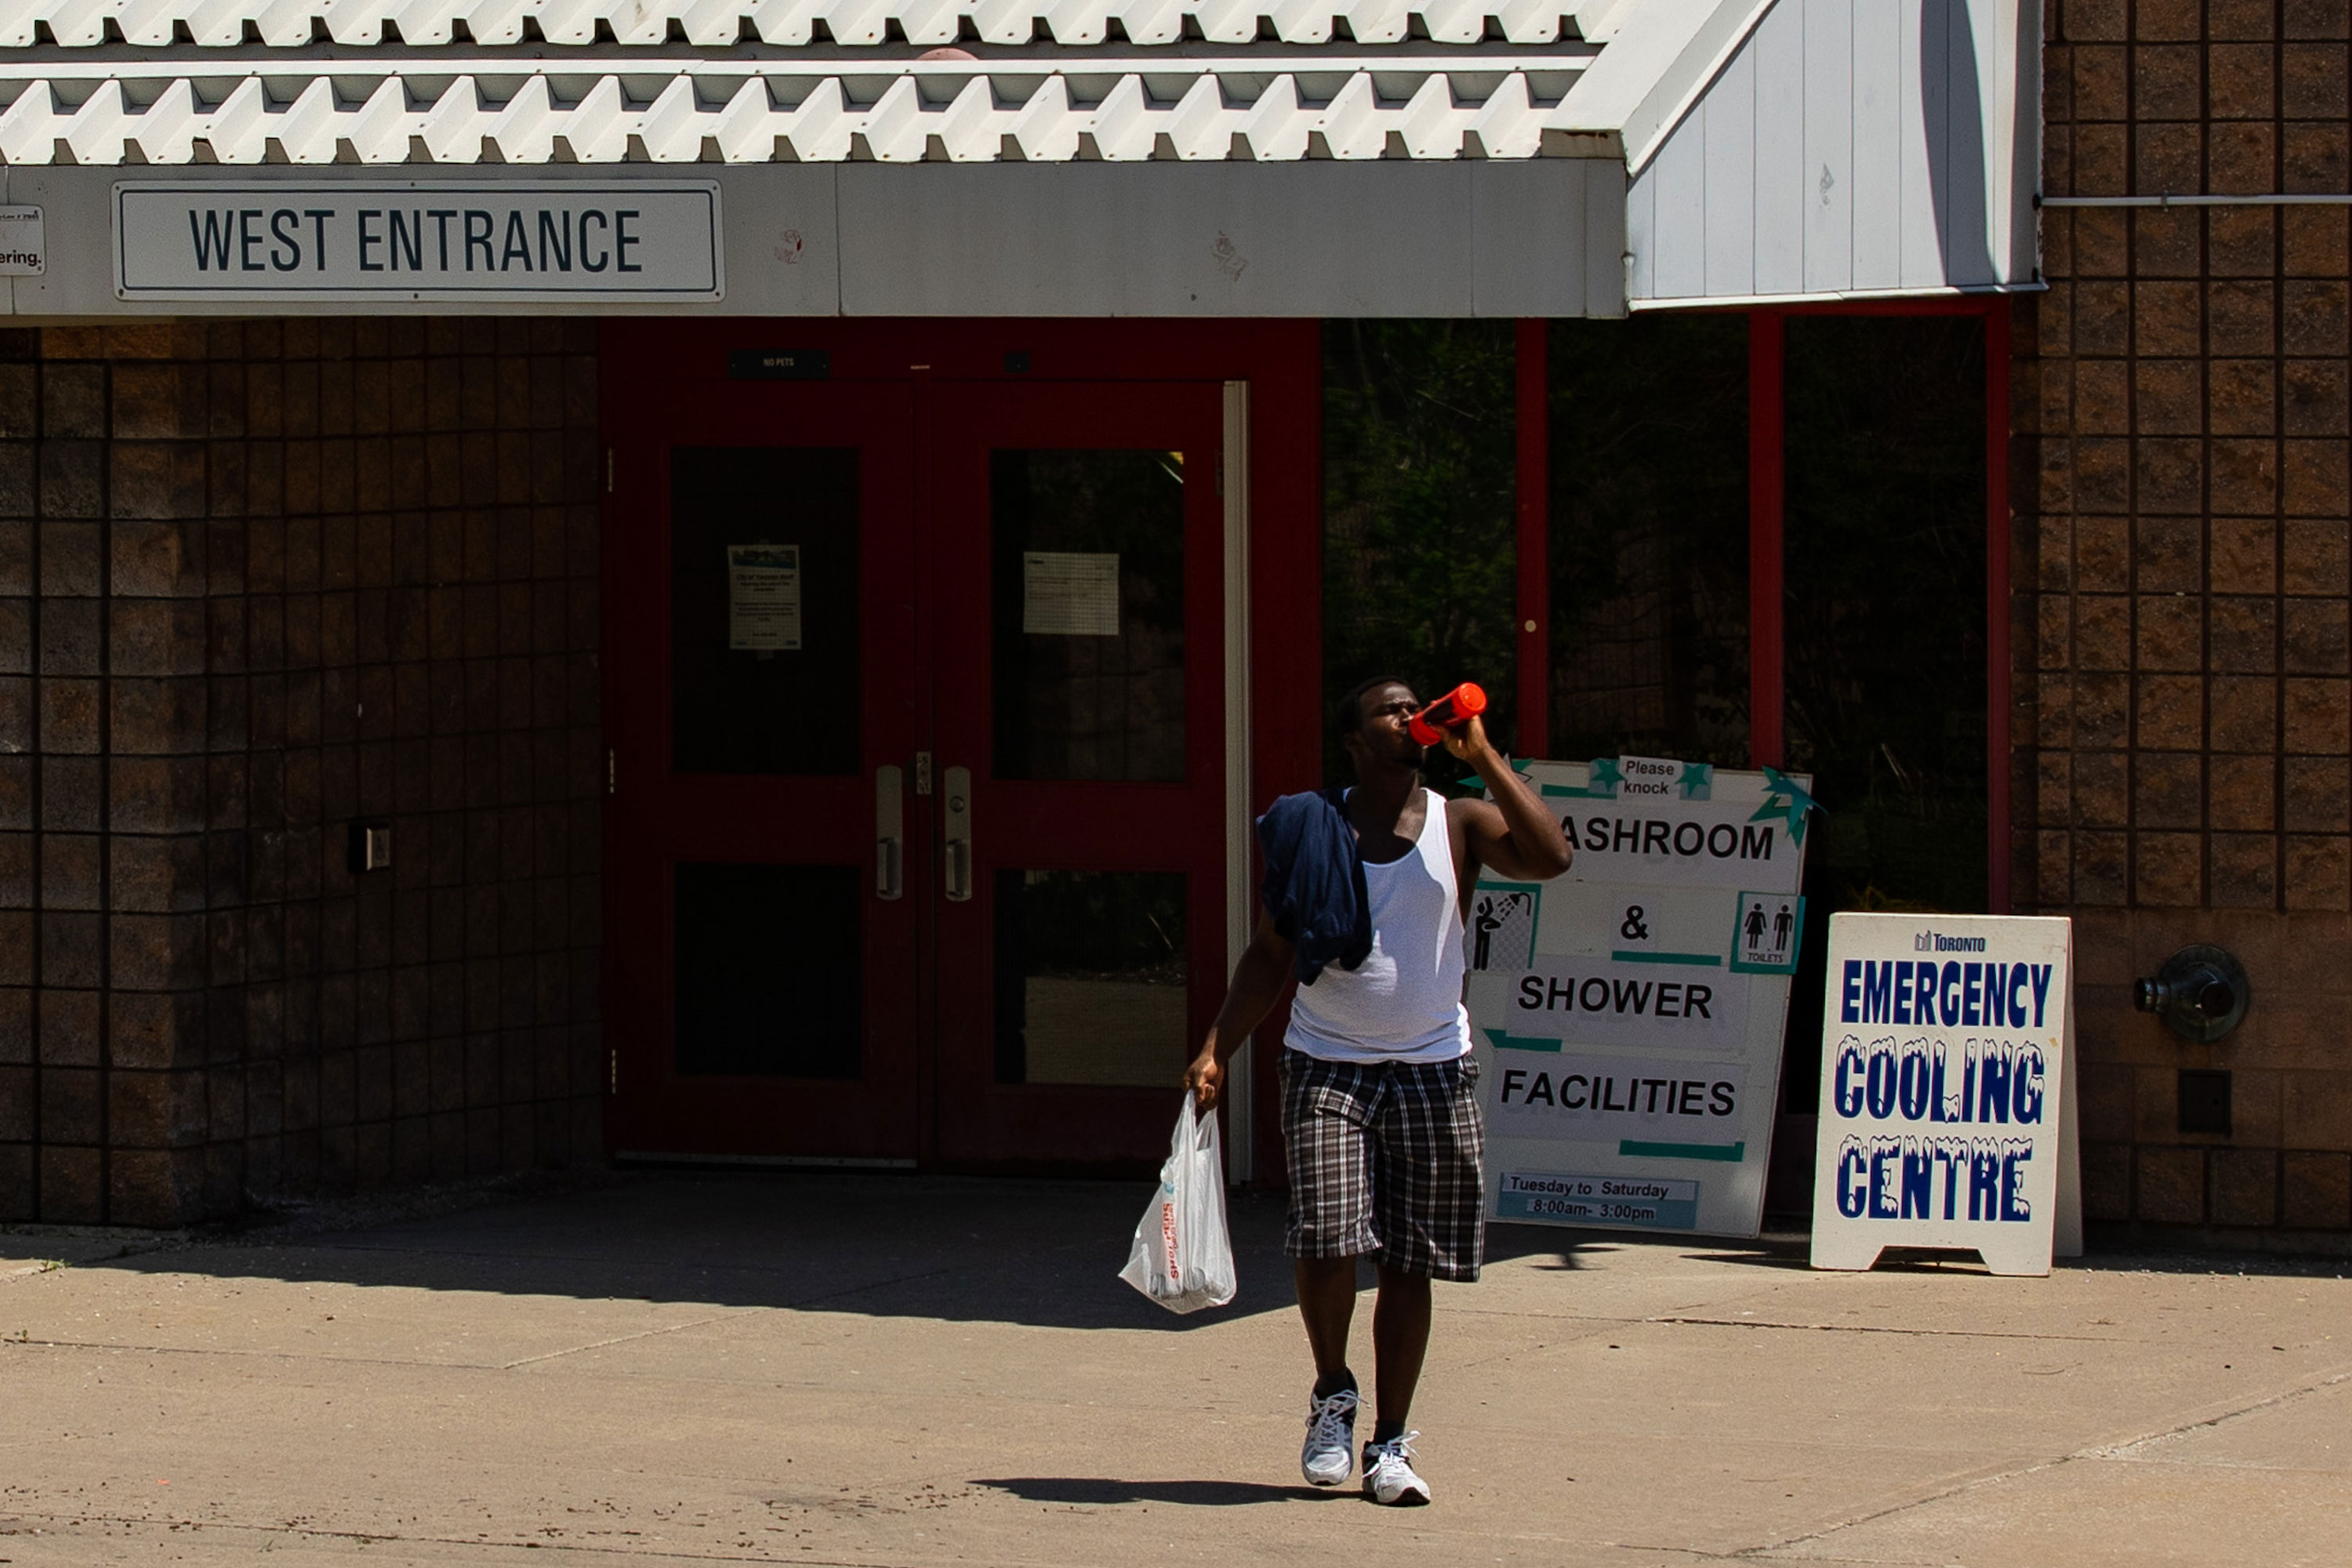
Heat-related deaths in Canadian cities can be prevented through mitigation measures — whether that’s by adapting homes to protect against and reflect the heat or through larger-scale initiatives, like planting trees and improving access to cooling shelters.
But the challenge is identifying where those measures are most needed.
To better identify where the most vulnerable populations live, researchers with the HealthyDesign.City program have created an interactive map of the country, with funding from the Public Health Agency of Canada.
The map overlaps satellite and census data to show where people in major cities are more likely to be at risk during heat waves.
This map of Vancouver, based on data interpreted by the HealthyDesign.City program, reveals how layers of risk multiply people’s vulnerability to extreme heat.
Brighter red dots illustrate warmer parts of the city, based on average land surface temperature data gathered from May to September 2019.
When income level is factored in, it reveals pockets where heat risk might be elevated. Brighter yellow dots show blocks where surface temperature and the proportion of low-income residents are higher.
Henderson says the map highlights areas of concern consistent with her research into the deadly heat dome — where mortality rates were high in east Vancouver and Burnaby, there were a lot of lower-income households, high traffic and a lack of green spaces.
She calls attention to heat risk beyond the most visible impoverished areas of the Downtown Eastside, as well as New Westminster and the Kingsway corridor.
Jeff Brook, the lead investigator of the HealthyDesign.City program out of the Dalla Lana School of Public Health and an associate professor at the University of Toronto, hopes the map can help urban planners and public health officials identify vulnerable parts of town before the next deadly heat wave hits.
“It’s really important that we see there are inequities with respect to the potential for heat to occur,” Brook said.
The tool uses satellite data to show surface temperature, which has some drawbacks. Surface temperature only shows the temperature of horizontal surfaces — like rooftops and parking lots — instead of air temperature and humidity, which would be closer to what people actually feel. Still, surface and air temperature are generally linked — if one is elevated, the other is likely to be as well.

Creating a standardized, nationwide map of urban variations in air temperature is essentially impossible right now, since Environment Canada monitoring stations are sparse and only located at sites like airports and university campuses.
Those who study urban heat are working to improve how it is measured and modelled. That includes developing larger networks of temperature monitoring stations, remote sampling of thermal temperatures through drones and aircraft, and more sophisticated computer modelling.
In the meantime, Brook says his maps can provide a guide for the work that needs to happen right now to help save lives.
“We don’t really have any time to waste.”
SHARE